Weekly Coronavirus figures for Bedford Borough published
30 Aug 2020
The latest weekly coronavirus statistics for Bedford Borough was published earlier this week.
We have had an increase in cases, but the number is still down from our previous high rate.
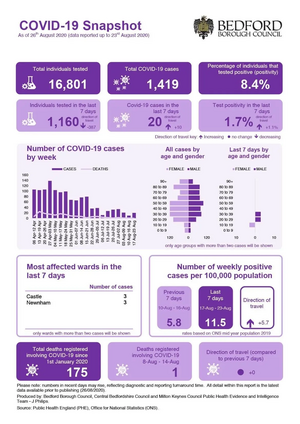
Presented once again in easy-to-read infographic form, the figures show that in the seven days up to 23rd August:
- 1,160 people have been tested
- There were 20 Covid-19 cases (up from 10 in the previous week)
- The weekly positive cases per 100,000 population was 11.5 (up from 5.8 in the previous week)
You can see the chart in full on Mayor Dave's facebook page here.
Please do continue to socially distance, wear a face covering on public transport, in shops, supermarkets, enclosed spaces, in other locations when asked and wash or sanitise your hands regularly.